
Running Effectiveness: The Hidden Metric That Makes You Faster Without Working Harder
Most runners track pace, heart rate, mileage, or power. Very few track the metric that shows how efficiently they actually run.
Running Effectiveness (RE) is the metric that reveals how efficiently you turn effort into speed.. When RE is high, running feels smooth, economical, and fast. When it drops, you’re leaking energy through mechanics, pacing, or fatigue.
RE is the difference between working hard and running well.
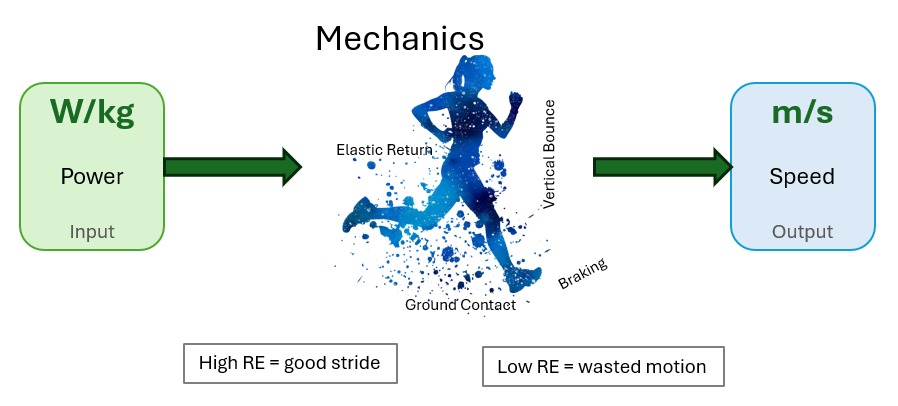
What Running Effectiveness Measures
RE = speed (m/s) ÷ power (W/kg)
It tells you four things no pace chart can show:
- Mechanical efficiency — how effectively you turn watts into forward speed.
- Movement economy — whether you waste energy through braking, bouncing, or long ground contact.
- Form under fatigue — RE shows exactly when your technique breaks down.
- Pacing quality — inconsistent pacing lowers RE and costs you time.
Important: RE is a ratio. High RE with very low power can be misleading. Always read RE alongside absolute power, speed, and mechanical patterns, not in isolation.
How to Measure RE Properly
To get meaningful RE data, consistency matters:
- Calibrated running power meter
- Reliable GPS
- Flat, steady 10–30 minute segment
- Power normalised to W/kg
- 30–60 second smoothing
- Context recorded: shoes, surface, wind, fatigue
This gives you a clean baseline instead of numbers pulled from a hilly club run. To work out your Running Effectiveness from power‑meter data, use the SuperPower Calculator. Steve Palladino walks through exactly how in his video.
(https://www.youtube.com/watch?v=xNIjgDGc_0I)
Typical RE ranges
- Elite: 0.80–0.90
- Strong club: 0.72–0.80
- Recreational: 0.65–0.72
- Developing: 0.55–0.65
Most runners sit lower than they expect, not because they’re unfit, but because their mechanics aren’t helping them.
How WKO Stores Your Running Effectiveness — and Why Comparing Dates Really Helps Your Progress
One thing I want you to understand is that Running Effectiveness isn’t just a number from a single run. WKO actually stores all your RE data over time and builds it into a power‑duration curve, the same kind of curve we use for power, but focused on efficiency instead of output.
Every run you do with a power meter adds more RE data points. Over time, WKO shapes those into a curve that shows:
- how efficiently you move at different speeds
- how your efficiency holds up as fatigue builds
- how your RE responds to training blocks, recovery weeks, and races
This is where it becomes genuinely useful for you as an athlete. Because WKO keeps all this historically, we can compare your RE curve from different dates and see real progress:
- Before vs. after a training block We can check whether you’re running more efficiently at the same pace or power.
- Fresh vs. fatigued We can see how your efficiency changes late in long runs or races — a great indicator of durability.
- Season‑to‑season It shows long‑term improvements in technique, economy, and how well you hold form under load.
So instead of treating Running Effectiveness as a one‑off metric, WKO turns it into a long‑term performance marker. It helps us see not just how you ran today, but how your efficiency is evolving, which is exactly what drives better race outcomes.
What Lowers RE
Common limiters:
- Overstriding → braking forces
- High vertical oscillation → wasted bounce
- Long ground contact → low stiffness/reactivity
- Fatigue → form collapse late in sessions
These aren’t “bad habits.” They’re mechanical patterns and they can be trained.
How to Improve RE
Strength & power
Single‑leg squats, Romanian deadlifts, stability work.
Plyometrics & stiffness
Low‑volume hops, bounds, short‑contact drills.
Technique & cadence
Fast‑cadence strides, short‑contact hops, cues like “forward, not up.”
Fatigue resistance
Tempo runs, longer intervals, end‑of‑long‑run strides.
Shoe testing
Different shoes change RE, but they can also hide mechanical issues.
Quick RE‑Boosting Drills
- Short‑contact hops — 3 × 10 each leg
- Fast‑cadence strides — 6 × 20–30 seconds
- Bounding — 3 × 20 metres
- Hill sprints — 6 × 10–15 seconds
Simple. Effective. But only when targeted to your limiter profile.
Baseline RE Test
- 15 minutes easy warm‑up
- 20 minutes steady on flat terrain at aerobic threshold
- 10 minutes cool down
- Calculate RE using average speed (m/s) and power (W/kg)
This test reveals:
- how efficiently you run
- where you lose speed
- how your form changes under load
- your biggest mechanical limiter
- what training will give you the fastest return
Two‑Week RE Booster Block
- Day 1: Heavy strength
- Day 2: Easy run + fast‑cadence strides
- Day 3: Tempo 20–30 minutes
- Day 4: Plyometrics + hill sprints
- Day 5: Long run + end‑of‑run strides
This is the kind of structured, targeted work that moves RE — and your speed — upwards.
Why RE Matters Even If You’re Already in a Running Club
Club training makes you fitter. RE shows whether that fitness is actually turning into speed.
Your club gives you community, consistency, and great sessions, but it can’t measure:
- braking forces
- wasted bounce
- ground contact time
- form under fatigue
- mechanical efficiency
- how much speed you lose without realising
That’s the gap RE fills. And once you see your RE profile, you can’t unsee it.
Where Coaching Fits In (Only After RE)
Once you understand RE, the next question becomes obvious:
How do I improve it?
That’s where coaching becomes essential. I track your RE, identify your mechanical limiter, and build targeted training that makes every club session more productive.
You keep the club. You keep the social side. You keep the fun.
You just get faster.
-
Pace vs Power
Pace vs power: which metric really drives performance? This fast, science‑driven debate breaks down race…
-
Understanding Training Load and Adaptation
Ever wondered why you feel amazing after a few easy days? This guide explains how…
-
Running Effectiveness
Running Effectiveness shows how efficiently you turn effort into speed. Learn how to measure it,…
